Editor's note: This story is part of the WardsAuto digital archive, which may include content that was first published in print, or in different web layouts.
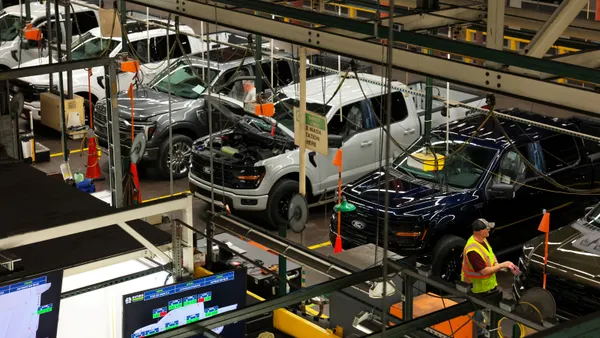
In what's shaping up as a tough first quarter, North American vehicle production for February and March is forecast to run well below year-ago, although output is gaining some momentum following the unexpectedly weak January finish.
As of presstime, Ward's latest near-term forecast had North American plants building 1,293,300 units in February, an average of 64,665 daily that beats January's 57,781-a-day pace by 11.9%.
March is forecast at 66,295 daily on a volume of 1,458,500 units, besting February's pace by 2.5%.
Although the general upward trend in first-quarter output tracks history, as auto makers typically build inventory for the coming spring seasonal sales uptick, lower market expectations in the first half of this year have prompted manufacturers to operate assembly plants more judiciously.
As a result, February's pace was forecast to trail like-2006's 68,610-per-day rate by 5.7%. March, with one less regular workday this year, is down 5% from year-ago's 69,752-unit pace.
Industry available straight-time capacity utilization in February was forecast at 89.5%, down from 93.3% a year ago, with rates for individual manufacturers varying widely. DaimlerChrysler AG's North American plants, for example, were seen running at 101.1% of available straight-time capacity in February, thanks largely to ongoing production ramp-ups at some Chrysler Group plants. However, that is below DC's 106.0% rate in February last year.
Likewise Toyota Motor Mfg. and Engineering of North America Inc. (including its share of output at New United Motor Mfg. Inc.) was geared toward a capacity utilization rate of 101.9% in February, down from 103.0% last year. Honda of America Mfg. Inc. will operate at a 105.8% pace, up from year-ago's 97.7%.
General Motors Corp. (including its share of NUMMI and CAMI Automotive Inc. output) was expected to run at 84.7% of capacity, and Ford Motor Co. (including Mustang output at AutoAlliance International Inc.) at 86.5%.
Both also paced below their straight-time capacity in February 2006, when they posted 88.8% and 92.1% tallies, respectively.
Ward's forecasts entire first-quarter output to average only 62,940 daily on volume of 3,965,200 vehicles, 7.5% less than average daily output of 68,051 in January-March 2006, when 4,287,200 cars and trucks were built.
Included in the 2007 tally is a weak January performance that saw several auto makers unexpectedly slam the brakes on their assembly lines to keep dealer inventory in check.
With somewhat of a sales recovery forecast for February and a stronger uptick seen in March, auto makers are moving to restore at least a fraction of the January losses. Exactly how much will depend on traffic at dealer showrooms.
| Production (in thousands of units) | Year-to-Date | % Available Production Month | ||||||||
|---|---|---|---|---|---|---|---|---|---|---|
| Mar. 2007 | Feb. 2007 | Jan. 2007 | Mar. 2006 | Feb. 2006 | 2007 | 2006 | 2007 | 2006 | ||
| DC | 294.4 | 255.6 | 185.4 | 304.2 | 236.9 | 735.3 | 732.9 | 101.1 | 106.0 | |
| Ford | 268.1 | 232.3 | 228.1 | 319.6 | 275.7 | 728.5 | 861.5 | 84.7 | 88.8 | |
| GM | 399.7 | 354.3 | 312.9 | 459.9 | 406.3 | 1,066.8 | 1,252.4 | 86.5 | 92.1 | |
| Honda | 128.0 | 120.5 | 127.2 | 131.1 | 116.3 | 375.8 | 363.0 | 105.8 | 97.7 | |
| Nissan | 113.9 | 93.9 | 98.5 | 115.4 | 103.0 | 306.4 | 315.9 | 68.3 | 71.5 | |
| Toyota | 148.4 | 130.5 | 145.9 | 143.1 | 120.4 | 424.9 | 404.8 | 101.9 | 103.0 | |
| Top Six | 1,352.6 | 1,187.2 | 1,098.0 | 1,473.4 | 1,258.7 | 3,637.8 | 3,930.5 | 90.0 | 93.2 | |
| Other | 106.0 | 106.1 | 115.4 | 130.9 | 113.6 | 327.4 | 356.6 | 83.5 | 94.6 | |
| Total U.S. | 1,015.9 | 907.2 | 857.6 | 1,169.6 | 970.9 | 2,780.7 | 3,072.6 | 88.5 | 95.0 | |
| Total Canada | 258.6 | 229.3 | 210.6 | 236.5 | 232.8 | 698.4 | 684.6 | 94.1 | 85.0 | |
| Total Mexico | 184.0 | 156.9 | 145.3 | 198.3 | 168.5 | 486.1 | 530.0 | 88.5 | 94.5 | |
| Total N. America | 1,458.5 | 1,293.3 | 1,213.4 | 1,604.3 | 1,372.2 | 3,965.2 | 4,287.2 | 89.5 | 93.3 | |
| U.S. Production SAAR (in millions)* | ||||||||||
| Total Light Vehicle | 9.9 | 10.4 | 10.5 | 11.4 | 11.1 | 10.3 | 11.2 | — | — | |
| Total Vehicles | 10.2 | 10.8 | 10.9 | 11.9 | 11.5 | 10.6 | 11.7 | — | — | |
| Note: Data includes medium- and heavy-duty trucks. DC includes Chrysler, Mercedes and Freightliner. GM, Ford and Toyota include production for them by joint ventures. “% Available Production” is forecast production as a percent of available straight-time capacity. Available capacity is the amount of straight-time output each manufacturer can build for the stated period taking into account the number of shifts each plant typically works, normally scheduled holiday and vacation downtime, and shutdowns for retooling. February and March 2007 and Mexico January 2007 are forecast. Except for some estimates for medium-/heavy-duty trucks, January is actual. *SAAR is seasonally adjusted annual rate for the the U.S. only and based on factors from the Federal Reserve. Source: WardsAuto.com. | ||||||||||